2016 Novelist Income Survey Results, Part 1
Introduction
There’s a lot of misinformation out there about the fabulous lifestyle of the working novelist. Everyone knows once you write a book, the money starts rolling in, right? There’s champagne and movie deals and hanging out with J. K. Rowling and Stephen King and Rick Castle.
Or maybe you’ve heard the opposite extreme, how all novelists are living on water and Ramen, making more money from scrounging couch cushions than we do from the books we’ve poured our blood and souls into.
For nine years, I’ve been doing an annual blog post about my writing income. I know a few other authors who’ve done the same. The main idea is to put the data out there to help build a more realistic picture of life as a working writer.
Those few data points are better than none, but this year, I wanted to go bigger. For roughly six weeks, I collected data from novelists who had at least one book published prior to 12/31/2016. Thank you to everyone who participated, and everyone who spread the word.
Are you read to start going through the results?
Overview
There were a total of 386 responses. Five of these were duplicates and were removed, leaving data from 381 individual novelists.
The survey asked questions about the number of novels published, how they were published (large publisher/small press/self-pub), income and expenses, genre, whether or not they used an agent, which country the novelist was in, and more.
As we go through the numbers, please keep in mind:
- This is not a truly random or representative sample. I have no way of reaching all the working novelists in the world, and not everyone who heard about the survey chose to participate. That said, I think 381 is pretty darn good.
- Correlation is not causation. The numbers might show that novelists with an agent make more/less money than novelists without. This doesn’t necessarily mean that having or not having an agent causes you to make more/less money.
- I am not a professional statistician. I’ll do my best, but if you see mistakes, please say something so I can correct them.
I know, I know. Enough with the disclaimers. Let’s get on with the yummy, yummy data!
Gross Income
Let’s start by looking at how much our authors made in 2016 before taxes or expenses. The total ranged from a few dollars to almost five million. Eight novelists made more than a million dollars (before taxes) in 2016.
- I admit, I was a little surprised by this, and wondered if maybe people were exaggerating or hit an extra zero. Fortunately, the survey also asked for an identifier (name or other) and an email address for anyone who wanted to be informed of the survey results. Looking at who was reporting these numbers, I believe they’re accurate.
Average Income: $114,124
Median Income: $17,000
(I think the median is more useful than the average, here. The average is pulled up significantly by those very successful outliers.)
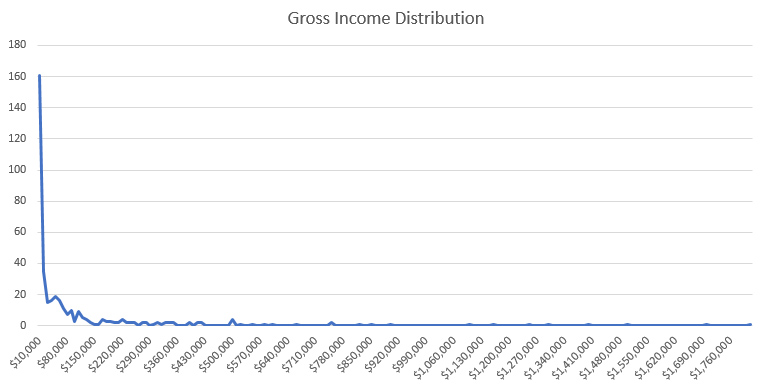
Distribution: As you might have predicted, the distribution is weighted heavily toward the left side of the graph. I removed one far-right outlier for this graph.
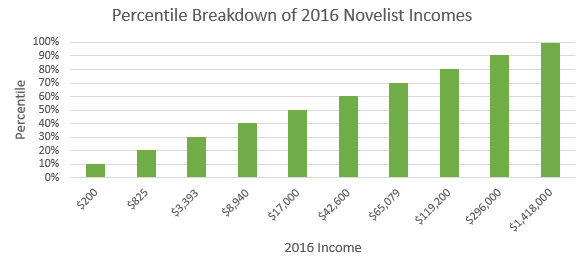
 Percentile: Here’s a percentile breakdown showing the same data in another way.
 In other words, ten percent of all respondents earned $200 or less last year. Before taxes and expenses.
Twenty percent made $825 or less. Thirty percent were $3393 or below, and so on.
If you earned at least $296,000, you were in the 90th percentile. And if your writing brought in $1,418,000 or more, you are officially the 1% among novelists.
Gross Income for Different Categories
Let’s play with those numbers a bit more. What happens if we separate agented and unagented authors, full-time vs. part-time, and so on?
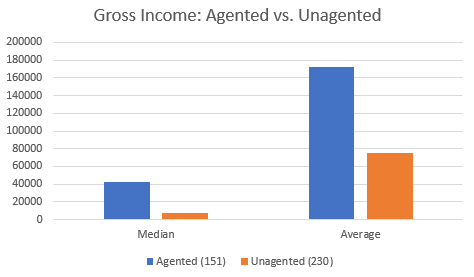
Agent vs. Unagented: Of our 381 respondents, 151 were represented by an agent, and 230 were unagented. There’s a significant difference in these two groups, but be careful about drawing too many conclusions here. Does having an agent mean you make more money? Or does making more money mean you’re more likely to want an agent? Or maybe it’s both or neither.
Median income for authors with an agent was $42,000. For authors without an agent, the median was $7000.
Looking at the eight authors who made a million or more, five were represented by agents and three were unagented.
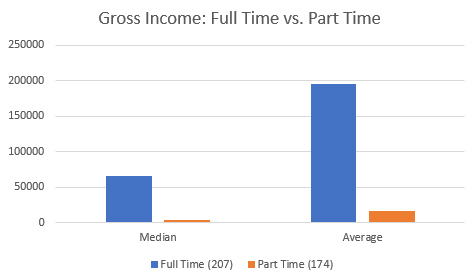
Full Time vs. Part Time: We see a similar pattern here. Disclaimer: the question on the survey asked if writing was “your primary, full-time job” during 2016. I probably could have worded that one a little better, as it’s possible we had writers working 40 hours/week on books and also working full-time elsewhere. But in general, I think the data here are pretty accurate and reliable.
Median income was $3050 for part time writers, and $66,000 for full-timers. Also, all eight of our $1,000,000+ novelists were full-timers.
Does this mean quitting the day job will magically increase your writing income by 22x? NO! Bad reader! Back to logic and statistics class for you!
Anecdotally, I started trying to write full-time at the end of 2015. 2016 saw an increase of about 10-15% in my overall income. But much of that came from a deal I signed before going full time. What does that mean? Heck if I know…
Conclusions So Far…
- It is possible to make a really good living as a novelist…but most of us don’t.
- It is possible to make a million or more as a novelist, with or without an agent…but again, most of us don’t.
- About 80% of novelists make less than $100,000 a year. Half of us make $17,000 or less.
And remember, these numbers are all before taxes or expenses!
In Our Next Episode:
I’ve got a lot more I want to do with the data, but it’s going to take a fair amount of time. (I’m also overdue on a novel deadline, so that has to be my priority.) I’ll continue to post results in sections, which should hopefully make it easier to digest. I’m planning to put the whole thing together and publish it as a big old report when I’m done as well.
I’ll also be sharing the anonymized raw data so other folks can play with it.
I hope this is helpful. If there’s anything in particular you’d like me to look into, let me know in the comments and I’ll do my best!
ETA: Here are the links to the next parts.
- Part 2: The Large/Small/Indie Breakdown
- Part 3: Number of Books Published in 2016
- Part 4: Impact of Marketing and Promotion
- Part 5: Miscellaneous Data


Tara
February 15, 2017 @ 4:38 pm
Interesting stuff! Will definitely come back for part 2.
If you plan on doing another survey in January 2018, it would be good to divvy up the fulltime vs parttime in ‘hours spent working’. Maybe with ranges? Of course, the amount of time writers spend on a book will vary hugely over a year, but it might be interesting additional data to have.
(BTW, I’m assuming someone has already mentioned AuthorEarnings, where Hugh Howey has been looking into author income for a few years now as well, but just in case. The more data, the merrier!)
Deborah K. Frontiera
February 15, 2017 @ 4:41 pm
Nice to know I fall pretty much in the middle. That is good news as an “indie” author. I’ll be looking forward to the rest of the results. May I share these results with friends?
Rachel Aaron
February 15, 2017 @ 5:10 pm
Great stuff!! I’m delighted to see so many writers doing so well. Can’t wait for part 2
Amelia Smith
February 15, 2017 @ 5:13 pm
Thank you! Do you have a breakdown by genre planned? I’m also curious about number of books vs. income and how long people have been in the novel-writing business.
Mari
February 15, 2017 @ 5:13 pm
Thank you, owner of the Ultrabeard, for this wonderful post
Ashok K. Banker
February 15, 2017 @ 5:16 pm
Nice work! Have been following the survey since the beginning. Finally contributed to it this time after being in the US for the past three years. Look forward to the next part of the results.
C. Gockel
February 15, 2017 @ 5:30 pm
Thank you so much for sharing this data!
--E
February 15, 2017 @ 6:05 pm
Is it wrong that I’m speculating who are the big earners? Especially the unagented ones. (I hope Chuck Tingle is in there.)
2016 Novelist Income Survey Results, Part 1 - by Jim Hines - C Gockel Writes
February 15, 2017 @ 6:14 pm
[…] I participated in a survey of novelist earnings. I’m lucky to fall in the top 30% of authors who make a good income. I feel very lucky, and most days I feel like I’m living in the Talking Heads Song “Once in a Lifetime.” I’m as surprised as anyone to be where I am. […]
Jim C. Hines
February 15, 2017 @ 8:03 pm
E – Not at all! But I’ll never tell
Jim C. Hines
February 15, 2017 @ 8:06 pm
Amelia Smith – I do indeed! I just need to figure out how to do it, since a fair number of folks said they wrote in multiple genres. (Multiple genres is great for a writing career; not so great for straightforward data analysis and graphs…)
Jim C. Hines
February 15, 2017 @ 8:07 pm
Deborah K. Frontiera – Please feel free to share with friends and enemies alike. The more information we get out there, the better off we all are.
Jim C. Hines
February 15, 2017 @ 8:08 pm
Tara – I have some hours-spent-writing data, but I need to look through that to see how clean and usable it is.
Fuuma
February 15, 2017 @ 8:30 pm
Hi, I’m sorry if this comes off as too critical, but your first graph (the percentile breakdown of 2016 novelist incomes) is misleading. When you glance at it, it makes it look like incomes rise in a linear fashion, which isn’t the case since the difference between each of the bars on the x-axis is not the same, which isn’t depicted visually. to understand what the graph is saying the viewer needs to read the entire x-axis number for number and interpret carefully or it looks like most people are making bank.
I’m piping up to say something because when this link is shared on FB, that graph is the image that shows.
So if you just switched your x and y axis’s variables then you would have more of a histogram (which is I think more what you intended?), so it would show the distribution of incomes. Or if you wanted a cumulative histogram, I would recommend a line graph instead of a bar graph, since it’s more intuitive to understand that way.
Hopefully this is helpful. Thank you for collecting this awesome and helpful information!
Alexander Claxton
February 15, 2017 @ 9:09 pm
I often find histograms more fully tell a picture than the percent under that income level (the name of the graph escapes me presently) as Fuuma commented previously.
Also, are there plans to regress salary on the various attributes you surveyed (e.g., having an agent, writing full time, etc)?
I’m excited to check out the anonymized data once you’re done, as I love using real data sets in my classes and I think this would be a fun one for students to dig into
Stella Garp
February 15, 2017 @ 9:13 pm
Hi! I’m unsure as to whether this is income from all sources or income from writing novels.
SherryH
February 15, 2017 @ 9:39 pm
Jim, thanks so much for doing this! It gives me hope that if I can get myself squared away and actually write, it may be possible to at least supplement the family income significantly. I’m far from it now, but…it’s something to strive for.
I, too, am interested in who the “Big Eight” are. I know you cannot ethically out them, but if they chose to reveal themselves here…well, that would be really cool.
I’m kind of bummed that I can’t see the graphs. You probably don’t want to overload readers here, but it would be really cool if you could also include it in table format in the final report.
Again, many thanks for this incredibly valuable resource!
Pixel Scroll 2/15/17 Do These Protocol Breeches Make My Throne Look Fat? | File 770
February 15, 2017 @ 10:23 pm
[…] (1) RETURN OF INCOME. Jim C. Hines has posted the first results from his annual survey of novelist income. […]
Andrew
February 16, 2017 @ 12:44 am
Another comment about that first graph – it would be much more effective as a histogram with a logarithmic scale on the y-axis.
Neal
February 16, 2017 @ 1:09 am
Why didn’t you create a histogram of the data. I would clearly show why there’s a massive disparity between average and median earnings. A cumulative histogram is also a better representation of graph #1.
Gregory Benford
February 16, 2017 @ 1:43 am
Far clearer to plot N($) number who made a given $ income vs. $ — the distribution function.
Paul Novitski
February 16, 2017 @ 5:22 am
I’ll be interested (but likely not surprised!) to see how gender correlates to income in your sample.
Michael J. Sullivan
February 16, 2017 @ 5:56 am
Great stuff, Jim. Thanks for putting this together. I’d love to get my hands on the raw data (and I was a participant. Can you send it to me at michael.sullivan.dc@gmail.com? Thanks!
Jim C. Hines
February 16, 2017 @ 8:17 am
::Reads comments::
So I’m starting to get the sense that people might want to see a histograph-type graph for the income distribution…
ETA: And your wish is my command! I’ve updated the post with an additional graph.
Jim C. Hines
February 16, 2017 @ 10:27 am
Paul Novitski – I didn’t actually collect gender data. Which I’m now feeling a bit foolish about, because yeah, that could have been quite eye-opening…
Something for me to keep in mind if I do this again next year.
Jim C. Hines
February 16, 2017 @ 10:29 am
SherryH – My apologies. I’ll definitely include the tables in the final report, and will try to do better with those on the rest of the blog posts as well.
Biz Strach
February 16, 2017 @ 2:54 pm
Hello!
As a data analyst (with an undergrad in math & stats and a graduate degree in analytics), but who has always loved reading (and has decided to start writing again soon..), reading this tickled every one of my fancies. I look forward to reading the next set of insights! And getting my paws on the raw data!
Brian Kilmartin
February 16, 2017 @ 3:38 pm
Hi Jim, fascinating stuff. Writers in Ireland do not seem to be faring so well. We did a recent article on Donal Ryan, a pretty well known writer, about him having to return to “full-time” work because the sums did not stack up. You can read the article here. http://www.irishtimes.com/culture/books/the-500-a-year-career-do-irish-writers-get-paid-enough-1.2965310
Sarah Avery
February 16, 2017 @ 4:23 pm
I’d be especially interested in seeing how debut novelists are doing. Thanks for doing this project!
Alexander Claxton
February 16, 2017 @ 4:34 pm
Just thinking about this some more: important things to control for would be number of items published, as the income per book published is a bit more informative than comparing someone who has published 8 books to someone who has published just one. Which isn’t to say that the number of books published is directly related to income, but it seems worth controlling for.
Additionally, it would also be interesting to compare length of being a published author (e.g., someone who first published in the 80’s to someone who published their first book in 2016).
Side note, I remembered the name of the graph: cumulative percentage graph.
Paul Novitski
February 16, 2017 @ 4:36 pm
You may be interested in a related project, Nicola Griffith’s Literary Prize Data working group
https://groups.google.com/forum/#!forum/literary-prize-data
“whose purpose initially was to assemble data on literary prizes in order to get a picture of how gender bias operates within the trade publishing ecosystem. (The $50,000 Half the World Global Literati Prize was established as a direct result.) The group’s interests have now grown to encompass other aspects of publishing and bias.”
See also Nicola’s website https://nicolagriffith.com/
2016 Novelist Income Results, Part 2: The Large/Small/Indie Breakdown
February 16, 2017 @ 4:41 pm
[…] This is the second chunk of data and analysis from the 2016 Novelist Income Survey. (Part one is here.) […]
Jim C. Hines
February 16, 2017 @ 5:10 pm
Sarah Avery – I asked authors when their first novel was published, so I should be able to separate out the debut novelists and compare/contrast there.
Jim C. Hines
February 16, 2017 @ 5:11 pm
Alexander Claxton – I’ve got both of those, and I agree completely. I’m trying to look at one variable at a time as much as possible.
The Noble Pen for Feb 23, 2017 | The Noble Pen
February 17, 2017 @ 11:00 am
[…] C. Hines blogs about author income, with some extensive statistics (part1)(part 2). The good news is there is lots of money to be made, so the mean income is attractive. […]
Annalee Flower Horne
February 17, 2017 @ 2:35 pm
Jim, thanks for running this! Very useful data.
If you run this survey again, I’d love to see breakdowns for race and gender, if folks feel comfortable supplying that info (and you felt comfortable asking for it). It’d be especially interesting to have that data paired up with particular publishers, but that’s probably outside your scope.
2016 Novelist Income Results, Part 3: Number of Books Published in 2016
February 18, 2017 @ 9:25 pm
[…] Part one […]
AMAZING NEWS 2-19-2017 - Amazing Stories
February 19, 2017 @ 11:03 am
[…] Jim C Hines Braks Down Author Earnings (Pt 1 Pt 2) […]
Raimey Gallant
February 21, 2017 @ 12:03 pm
Thank you for putting this together!
Loose-leaf Links #34 | Earl Grey Editing
February 23, 2017 @ 4:02 pm
[…] C. Hines conducted an informal survey of novelists regarding their 2016 income and has written a series of posts discussing the […]
2016 Novelist Income Results, Part 4: Impact of Marketing and Promotion
February 23, 2017 @ 5:17 pm
[…] Part one […]
2016 Novelist Income Results, Part 5: Miscellaneous Data
February 26, 2017 @ 1:28 pm
[…] Part one […]
What Do You Really Need to Be a Good Writer? – Do Not Hire This Editor.
April 23, 2017 @ 11:33 pm
[…] You, my friends, are the long tail. There is a key idea in Anderson’s writing: “You can’t make money being the long tail, but you can make money off the long tail.” That is why Amazon is rich and authors are poor.* (Here is a less spin-doctored, more human and smaller dataset from Jim Hines.) […]